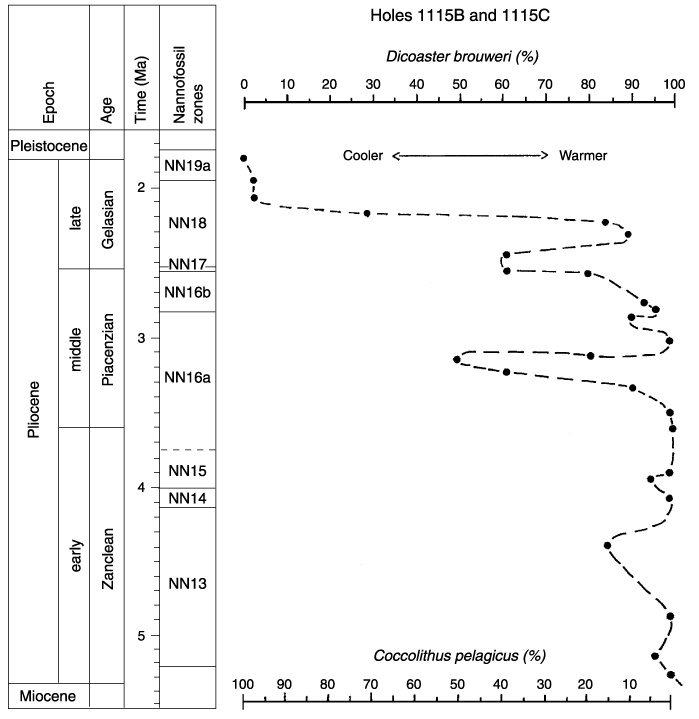
Figure F4. Changes in Pliocene surface water temperature at Site 1115, based on the relative abundance of Discoaster brouweri vs. Coccolithus pelagicus. See the "Appendix" for sample numbers. Curve inflections to the right indicate warmer water and vice versa. The timescale is from Berggren et al. (1995).

![]()