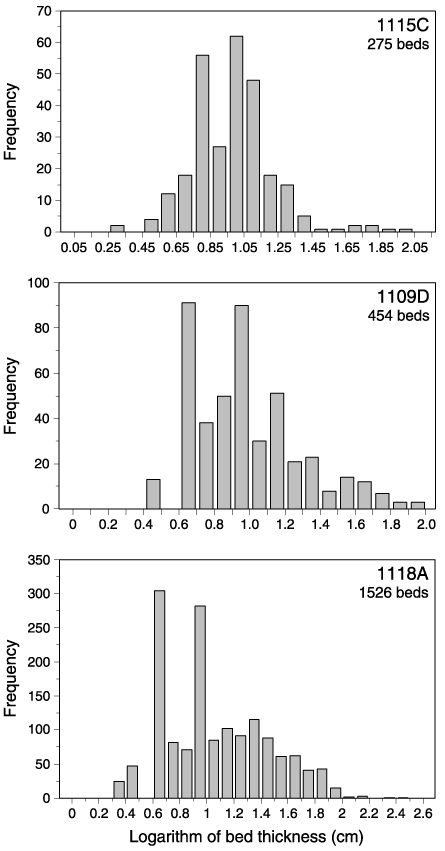
Figure F10. Plots showing the lognormal tendency of bed-thickness distributions for Pliocene silt and sand turbidites from Holes 1118A, 1109D, and 1115C. Values on the x-axis are powers of 10 (e.g., the bar between 0.6 and 0.7 shows the number of beds with thickness between 100.6 and 100.7 cm, or 3.98-5.01 cm).

![]()