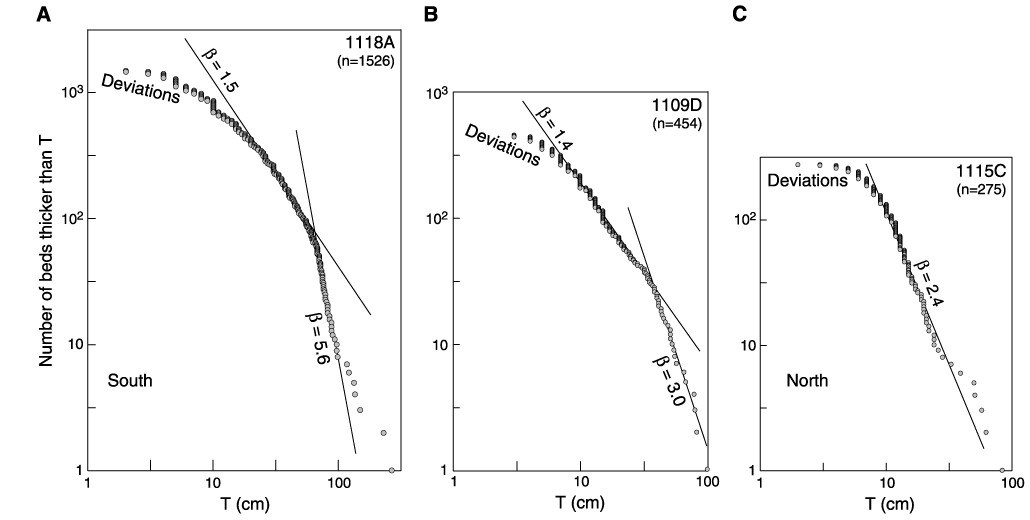
Figure F12. Logarithmic plots of the number of sand and silt beds thicker than T, vs. T, for data derived from FMS images. As predicted for power-law distributions, the data plot as straight-line segments with a slope that is the characteristic exponent of the distribution (Equation 2). A. Hole 1118A. B. Hole 1109D. C. Hole 1115C.

![]()