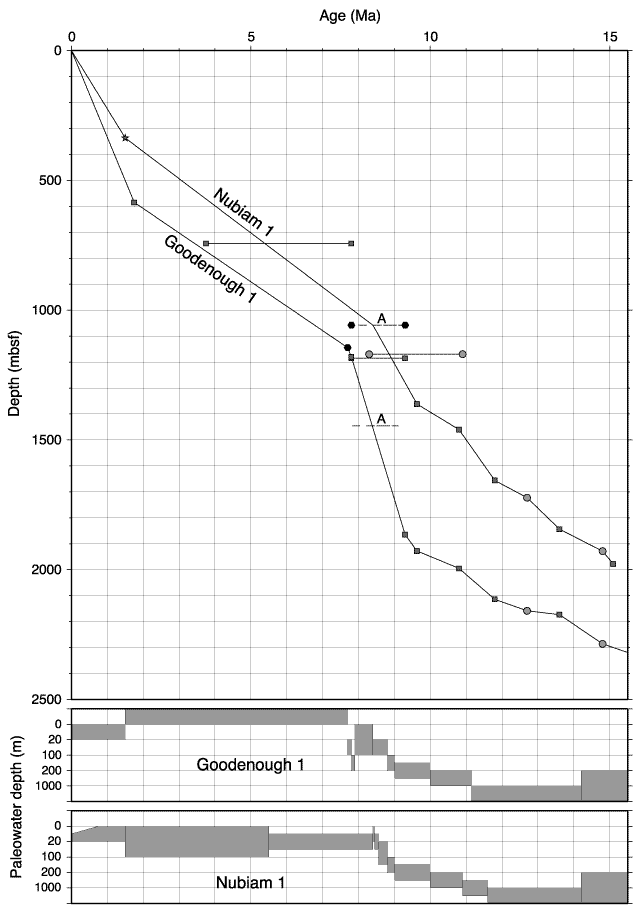
Figure F5.
Sedimentation curves at the Goodenough 1 and Nubiam 1 wells, based on
nannofossil (square) and planktonic foraminifer (circle) datum events and
lithostratigraphic correlation (star), derived from Harris et al. (1985). Dashed
lines locate the levels of regional unconformity "A" see Fig. F4.
Shown below are paleobathymetry ranges estimated from benthic foraminifers
(Harris et al., 1985).


![]()