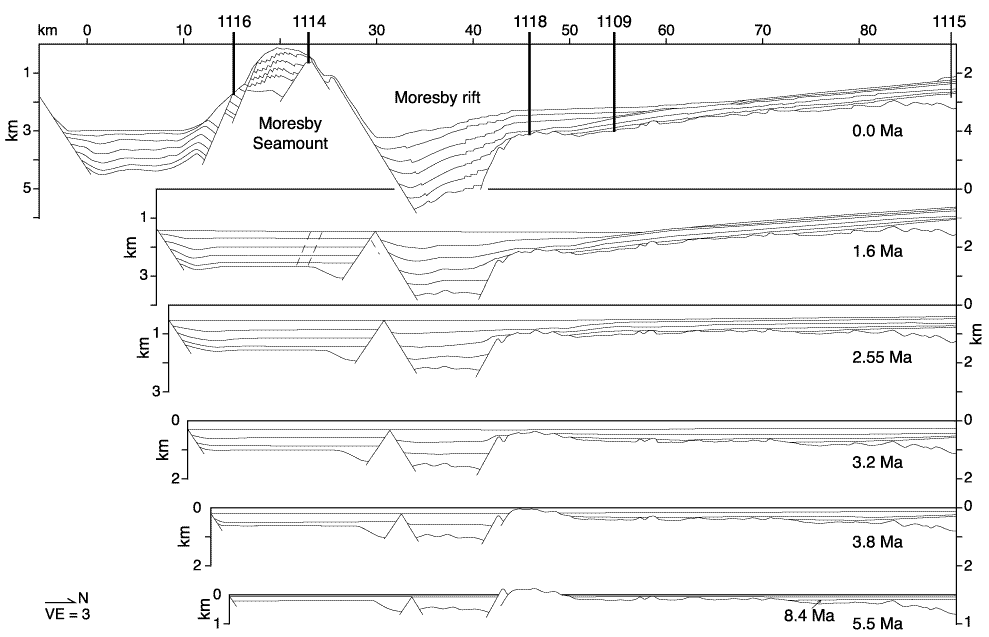
Figure F8.
Interpreted line drawing of MCS profile 1366 (top panel), reconstructed at 1.6,
2.55, 3.2, 3.8, and 5.5 Ma (lower panels) using constraints from seismic
stratigraphy (Goodliffe et al., this volume) and paleowater depths (Fig. F7)
(Shipboard Scientific Party, 1999).


![]()