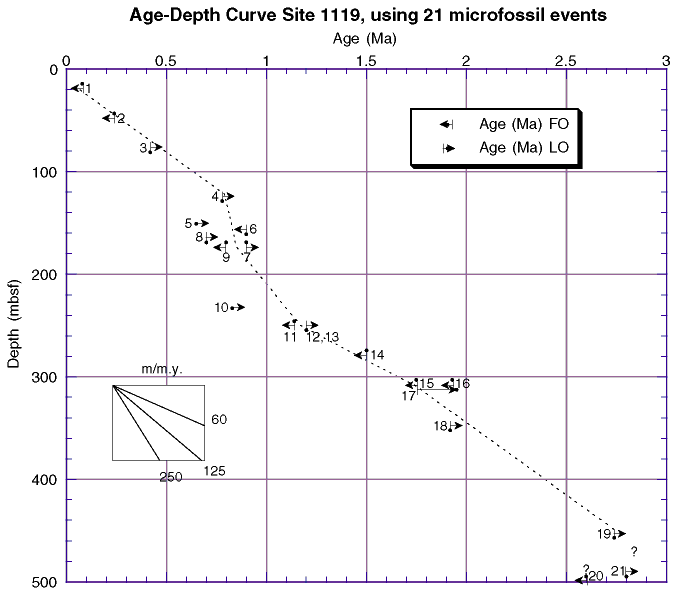
Figure F20. Age-depth curve using multiple microfossil datums for Site 1119. The best fit line is drawn according to subjective weighting of the chronostratigraphic and geochronologic precision of the events shown in Table T3, and it shows the preferred average sedimentation rate. Vertical lines on arrows indicate possible errors caused by large sampling intervals (FO errors extend downcore, LO errors extend upcore). Where sampling intervals are decreased, vertical lines are minimized or removed. Larger arrow length indicates uncertainty in age of datum. Question marks indicate additional uncertainties discussed in text.
