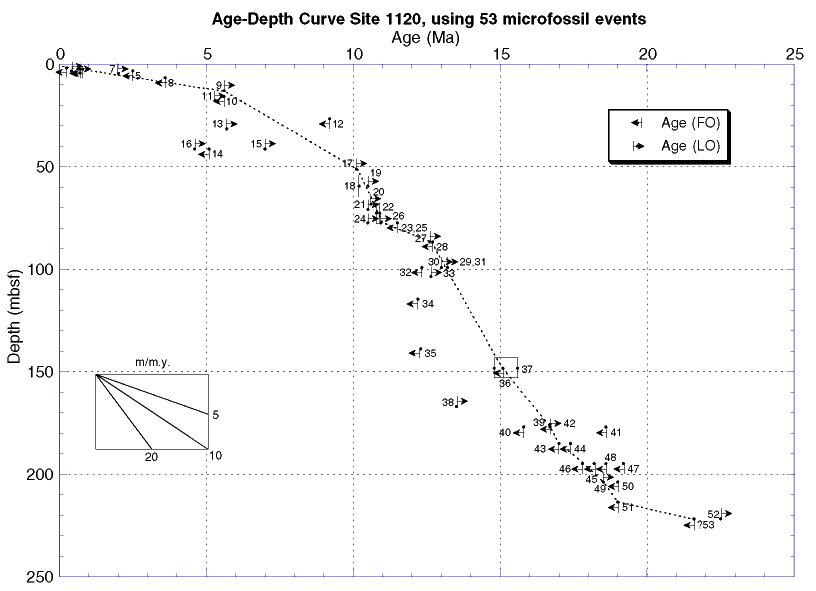
Figure F6. Age-depth curve using multiple microfossil datums for Site 1120. The best-fit line is drawn according to subjective weighting of the chronostratigraphic precision of the events listed in Table T11, and it shows the preferred average sedimentation rate. Vertical lines on arrows indicate possible errors resulting from large sampling intervals (FO errors extend downcore, LO errors extend upcore). Vertical lines with no arrows represent acme events or total range boxes. The change in average sedimentation rate at 50 mbsf is consistent with an abrupt change in lithofacies at this level.

