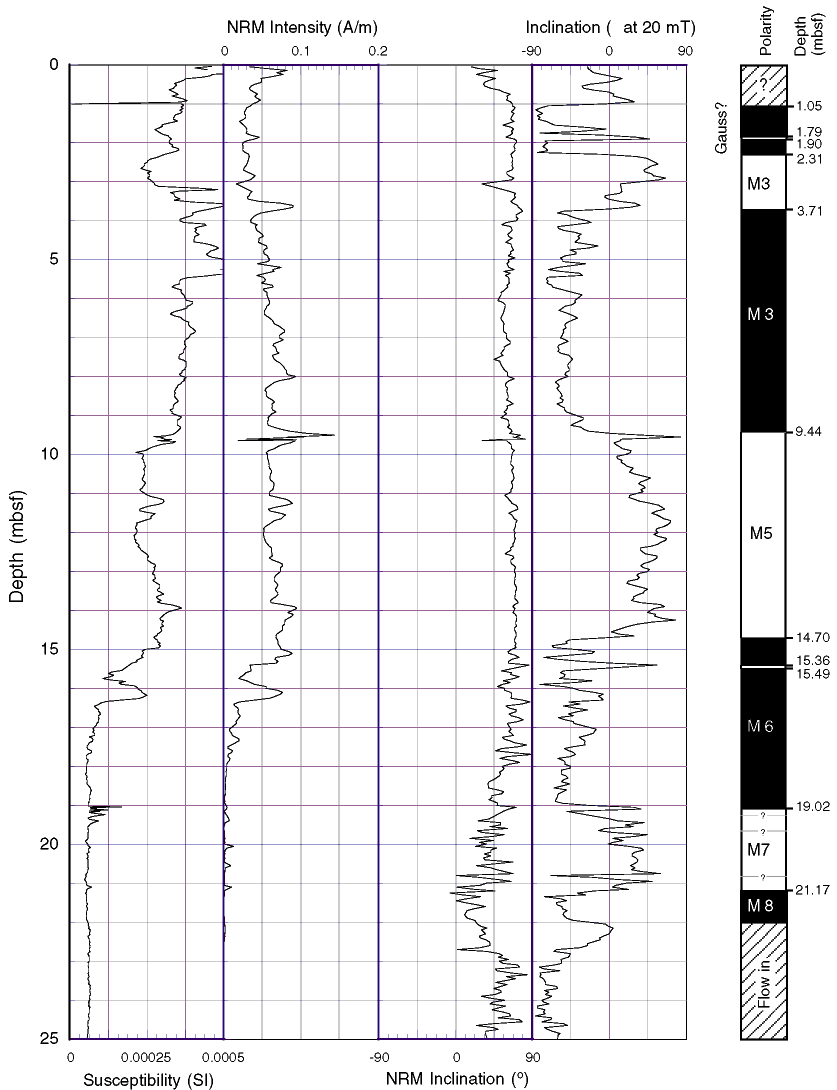

Figure F14. Whole-core magnetic susceptibility for the upper 25 mbsf of core from Hole 1121B from the Bartington loop of the shipboard automated multisensor track, archive-half continuous measurements of NRM intensity, and inclination before and after alternating-field demagnetization to 20 mT from the pass-though cryogenic magnetometer. Polarity interpretation is given on the right. Black (white) shaded intervals indicate normal (reversed) polarity, and hatched shading indicates intervals where polarity could not be determined because of "flow-in" or poor recovery. Unambiguous correlation of magnetochrons with the GPTS was not possible (see discussion in text).

