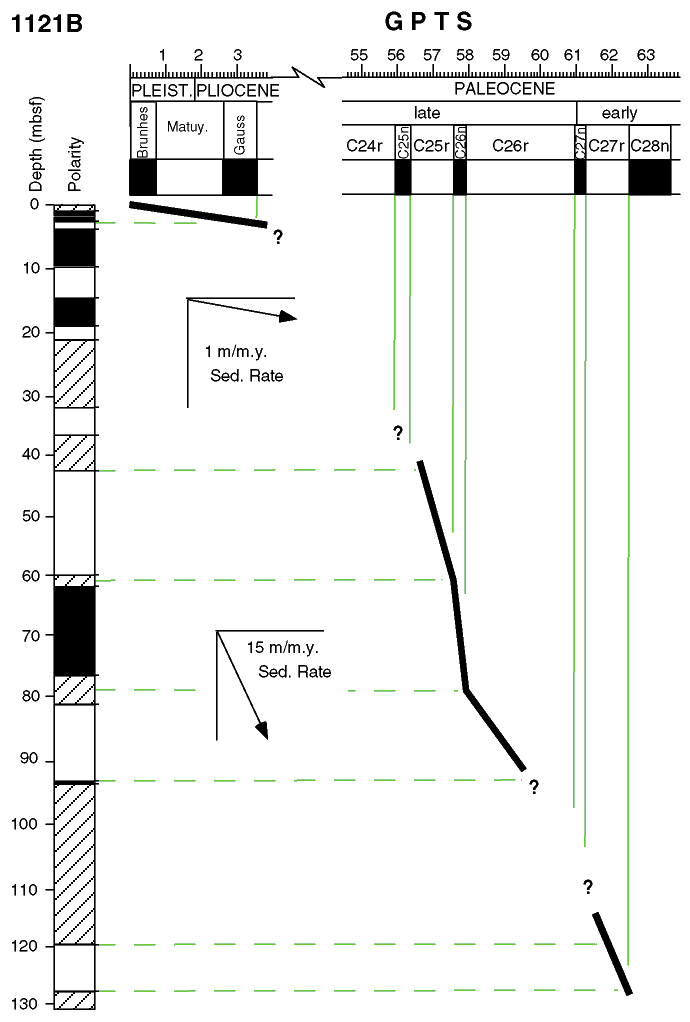

Figure F18. Correlation of Hole 1121B magnetic polarity zonations with the Geomagnetic Polarity Time Scale (GPTS) of Berggren et al. (1995) and Cande and Kent (1995). Black (white) shaded intervals indicate normal (reversed) polarity and hatched shading indicates intervals where polarity could not be determined because of "flow-in," poor recovery, or nonrecovery. Stippled and dashed lines show tie points for the correlation. Correlation is constrained by radiolarian and nannofossil zones determined for Hole 1121B (see discussion in text and "Biostratigraphy" in "Site 1121" chapter).

