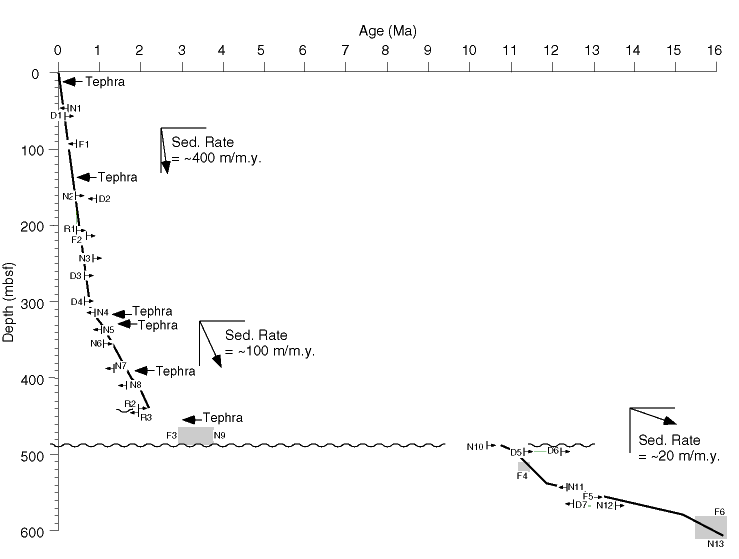
Figure F17. Age-depth curve using multiple microfossil and polarity chron datums for Hole 1122C. The best fit line is drawn according to subjective weighting of the chronostratigraphic and geochronologic precision of the events and approximate average rate of sedimentation. Numbers by datums (e.g., F1) denote events listed in Table T8. Wavy line at 490 mbsf represents a stratigraphic disconformity.

![]()