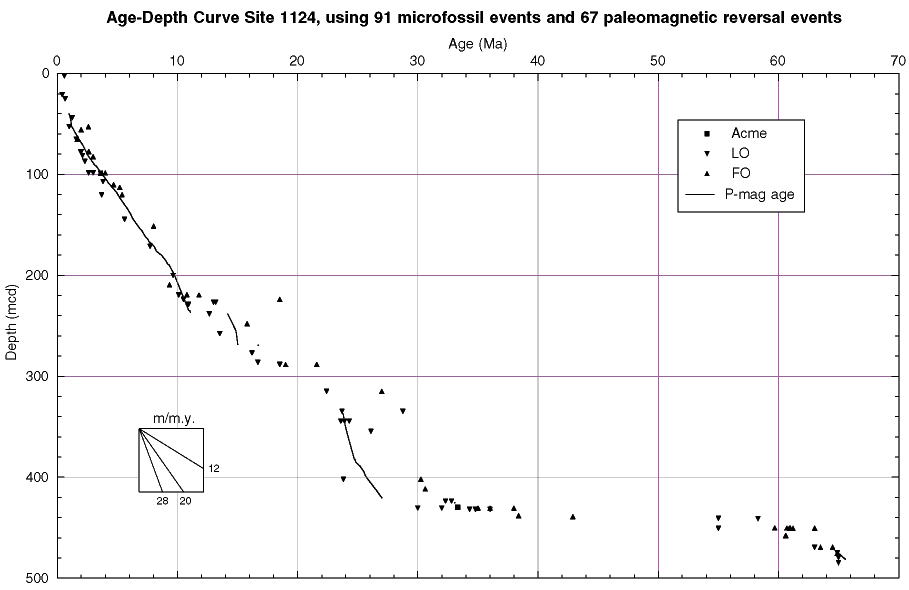
Figure F25. Age-depth plot, using the diatom, radiolarian, foraminifer, and nannofossil age assignments for Site 1124, as shown in Table T14. Because of the size of the plot, strongly or fully overlapping event positions may be obscured in the graph. All depths are reported in mcd values. The plot of events is tightly clustered and shows fairly good coherence. Solid line indicates the paleomagnetic age model from "Paleomagnetism" in the "Site 1123" chapter.

![]()