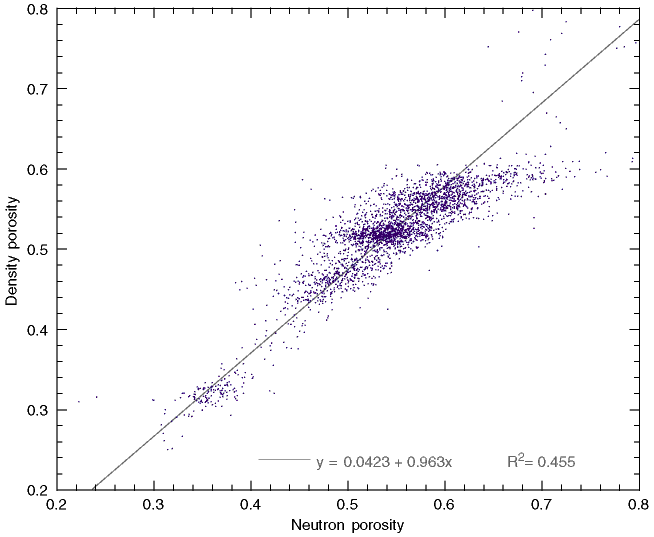
Figure F24. Crossplot of density porosity and neutron porosity. Note the slope of the regression line is close to 1. Reasons for the slight deviation from a slope of 1 are discussed in "Data Quality/Preliminary Interpretation" in "Downhole Measurements" in the "Site 1125: Productivity under the Subtropical Convergence on North Chatham Slope" chapter.

![]()