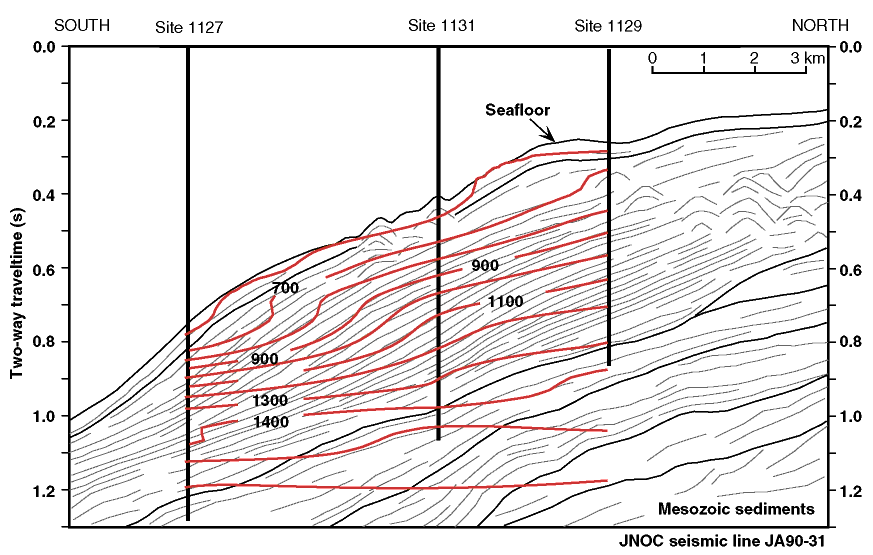
Figure F8. Contour plot of Cl- concentration at Sites 1127, 1131, and 1129, displayed overlying the interpretation of a seismic line joining the three sites. Note that the lines of equal Cl- concentration crosscut the seismic sequences and appear to originate from a subhorizontal brine. Cl- concentrations are given in millimoles per liter (mM). Normal seawater concentration is 559 mM.

![]()