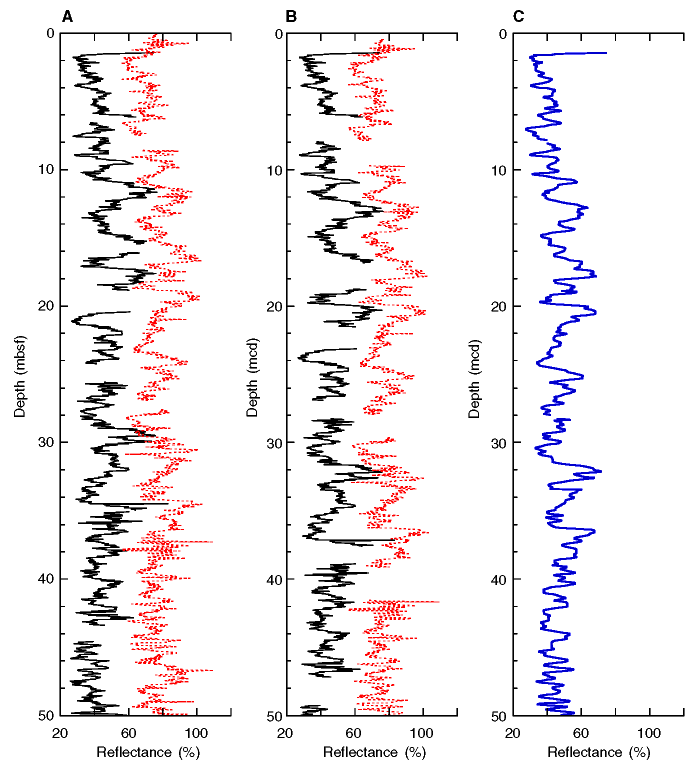
Figure F8. A. A 50-m interval of color reflectance records from Holes 1126B (solid line) and 1126C (dashed line) on the meters below seafloor (mbsf) scale. Records from different holes are offset for convenience. Equivalent events in adjacent holes are not aligned. B. Example of the composite section for the same interval shown in A. Events are now aligned on the meters composite depth (mcd) scale. C. The spliced record from the same site as above.

![]()