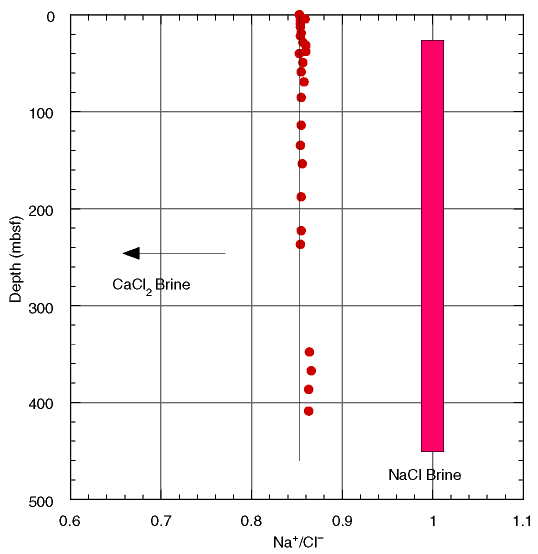
Figure F18. Summary trends in the Na+/Cl- ratio with increasing depth. Data from Site 1126 plot along a line near 0.86 equal to the Na+/Cl- ratio in seawater. Fluids arising from a NaCl brine plot near a value of unity, whereas fluids originating from a CaCl2 brine plot to the left of the figure.

![]()