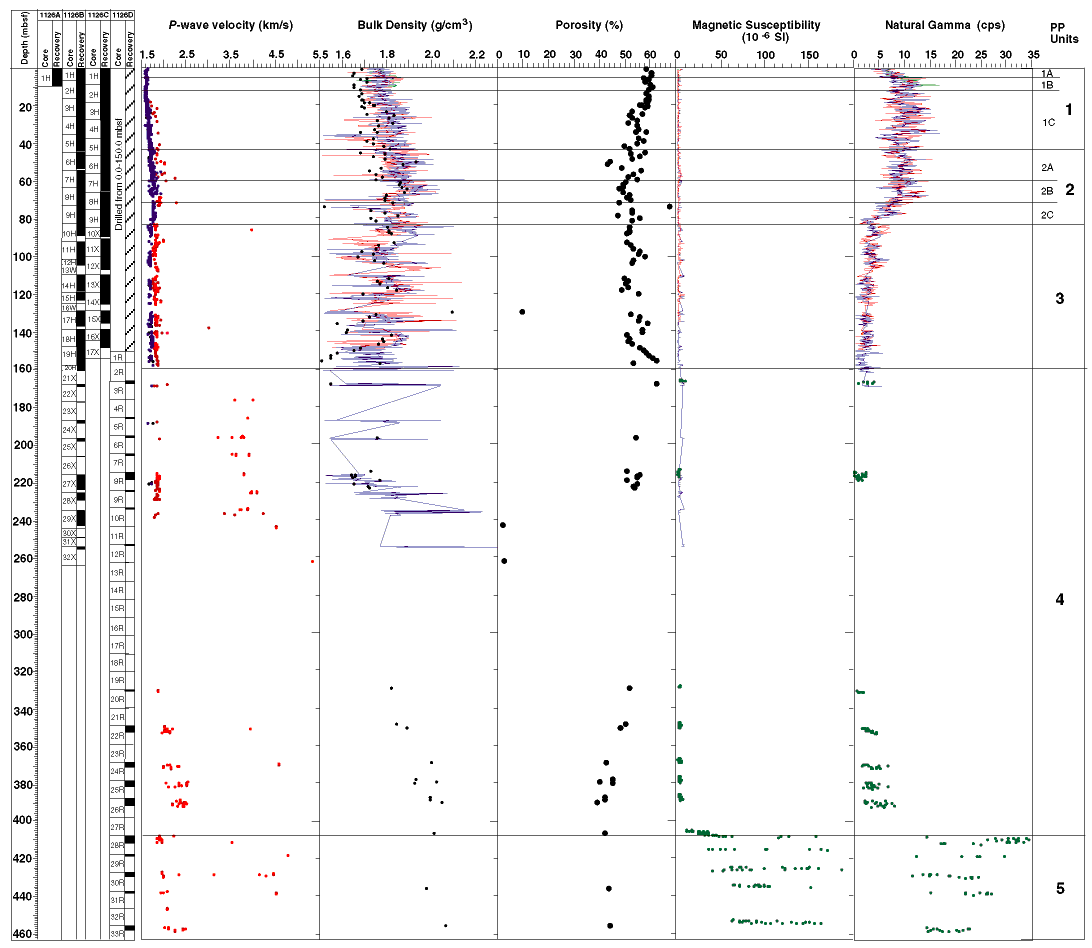
Figure F22. Combined plot of P-wave velocity (PWS1 and PWS2, blue; PWS3, red), gamma-ray attenuation (GRA; lines) and moisture and density (MAD; dots) bulk densities, porosity, magnetic susceptibility, and natural gamma radiation (NGR) from Site 1126. Black dots represent discrete density and porosity measurements. With the exception of P-wave velocity and porosity, Hole 1126A is indicated in green, Hole 1126B in blue, Hole 1126C in red, and Hole 1126D in dark green dots. Physical properties units (PP units) are indicated on the right. PWS3 velocities tend to be higher than those measured using PWS1 and PWS2 as a result of sediment compaction between the transducers.

![]()