![]()
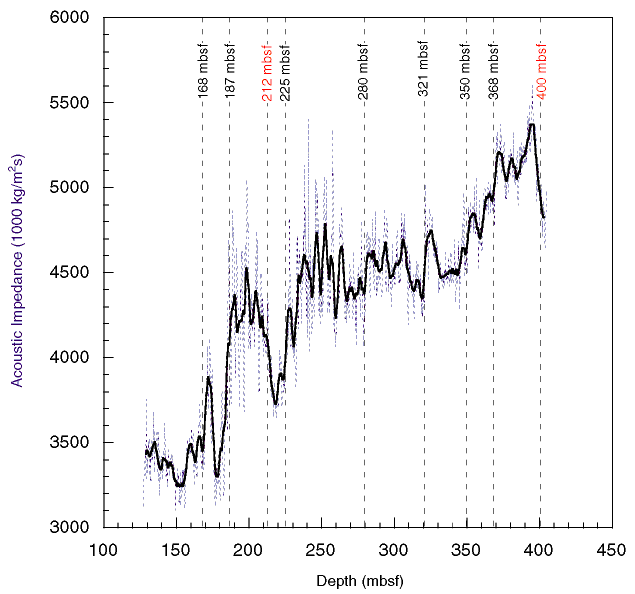
Figure F29. Log of acoustic impedance vs. depth calculated from density and sonic logs from Site 1126. Possible locations of seismic reflectors are shown. Dashed curve represents all data, whereas solid curve represents data smoothed using a 20-point running average.
![]()