![]()
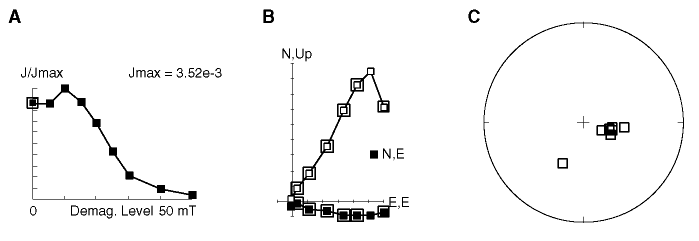
Figure F9. AF demagnetization behavior of Sample 182-1126D-33X, 87-89 cm. A. Intensity of magnetization plotted vs. demagnetization. B. Component diagram showing demagnetization north and east components with solid symbols and north and up components with open symbols. The first point and those selected for principal component analysis are shown with enlarged symbols. C. Equal-area plot of directions of magnetization during demagnetization. Demagnetization first removes a downward, steeply inclined magnetization that brings the direction of magnetization to the main group in C and is expressed as an increase in net magnetization in A and B. Then demagnetization reveals the characteristic magnetization that is determined by principal component analysis to be declination = 100.3° and inclination = -60.1° with a maximum angular deviation angle of 3°.
![]()