![]()
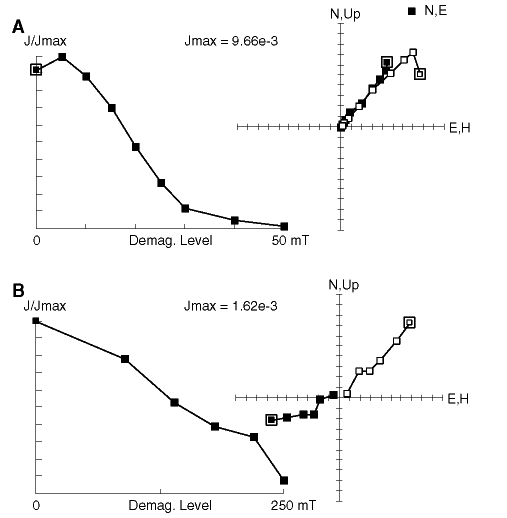
Figure F8. Normalized intensity decay (left) and demagnetization diagrams (right) of representative samples. A. Alternating field demagnetization showing two-component magnetization (Sample 182-1127B-25X-1, 135 cm). B. Thermal demagnetization showing univectorial decay of the natural remanent magnetization (NRM). Demagnetization diagrams show projections of the NRM vector in the vertical (open symbols) and horizontal (solid symbols) planes during progressive demagnetization (Sample 182-1127B-41X-3, 63 cm).
![]()