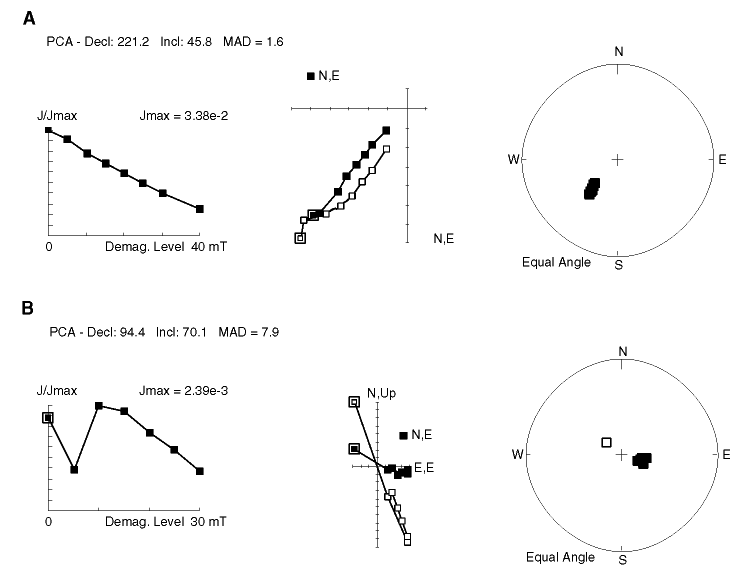
Figure F13. Alternating field demagnetization behavior of (A) soft sediment (Sample 182-1128B-4H-3, 63-65 cm) and (B) lithified (Sample 182-1128D-4R-1, 40-42 cm) discrete samples. The plot on the left shows the decrease in intensity upon demagnetization. The center panel gives the vector plots in the horizontal and north and up planes (north and east are solid symbols; north and up are open symbols). A stereographic projection of the directions is given on the right. Solid symbols represent downward directions and open symbols represent upward directions.

![]()