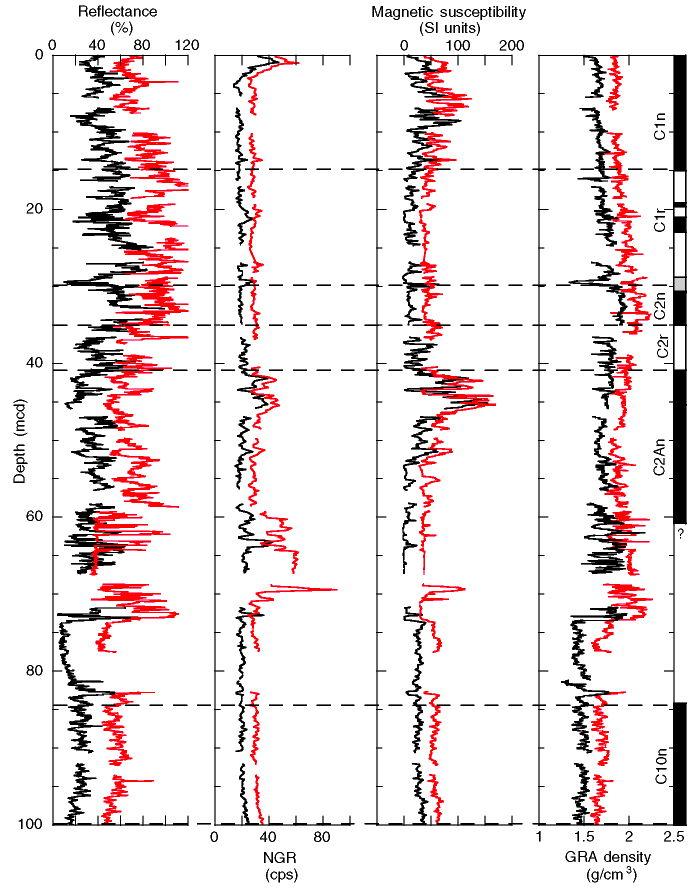
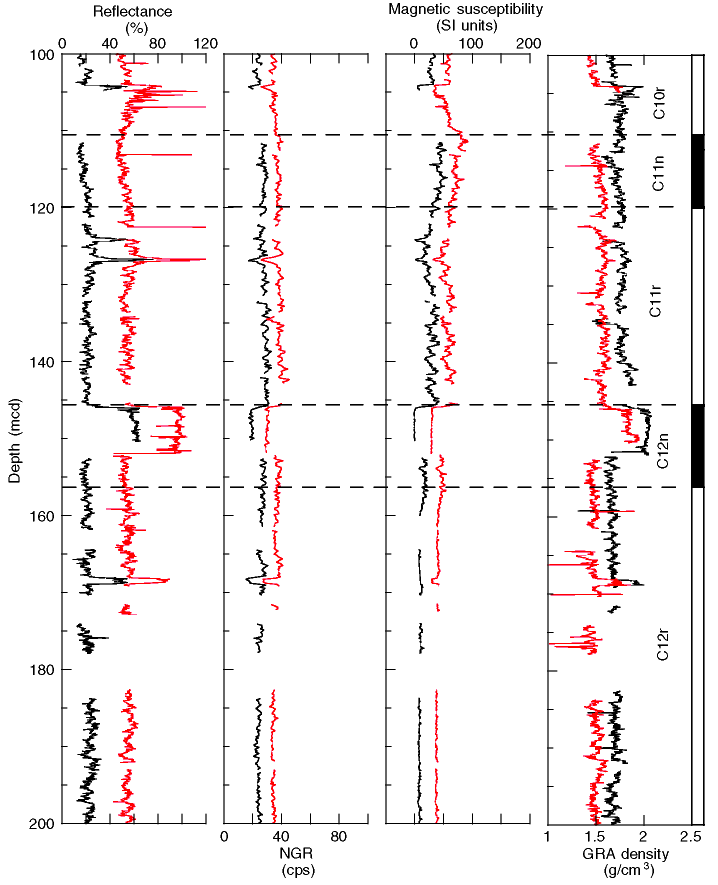
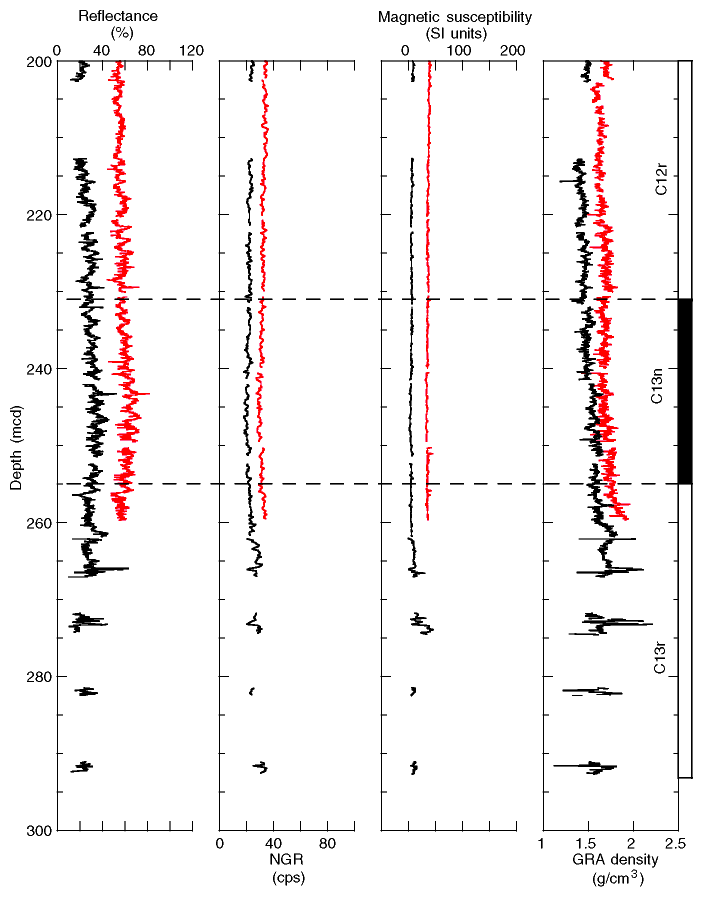
Figure F18. Composite depth section produced using the Splicer software. The black line is data from Hole 1128B, and the red line is data from Hole 1128C. Chrons are delineated by the horizontal dashed lines and identified on the right margin of the plots. Magnetic polarity is shown to the right of the chron identification. ? = magnetic intensity too low to measure. All depths use the meters composite depth (mcd) scale. For conversions from mcd to mbsf, see Table T3.


![]()