![]()
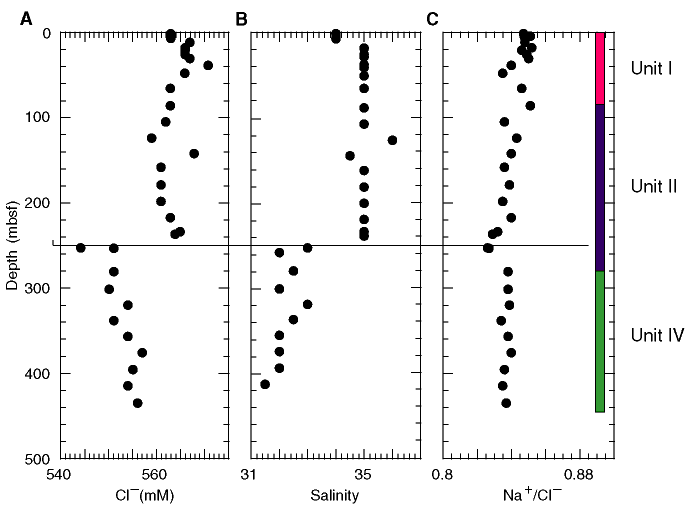
Figure F21. Summary of trends in (A) Cl-, (B) salinity, and (C) Na+/Cl-. The horizontal line denotes the abrupt change in the Cl- and salinity near the boundary of lithostratigraphic Units II and IV (see "Lithostratigraphy"). The Na+/Cl- ratio, however, remains constant throughout, within the analytical precision of the techniques used (see "Inorganic Geochemistry" in the "Explanatory Notes" chapter).
![]()