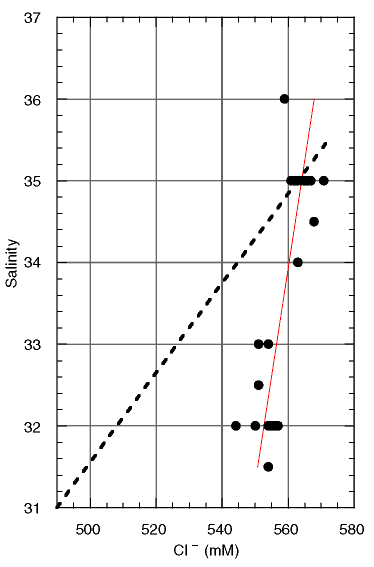
Figure F22. Relationship between salinity and Cl- at Site 1128. If changes are a result of simple mixing of waters with different evaporative histories, then samples should fall on a line with a slope of 0.063 (dashed line). Samples falling below this line have lower salinity as a result of the removal of several minor constituents. The solid line represents a regression of the salinity and Cl- data.

![]()