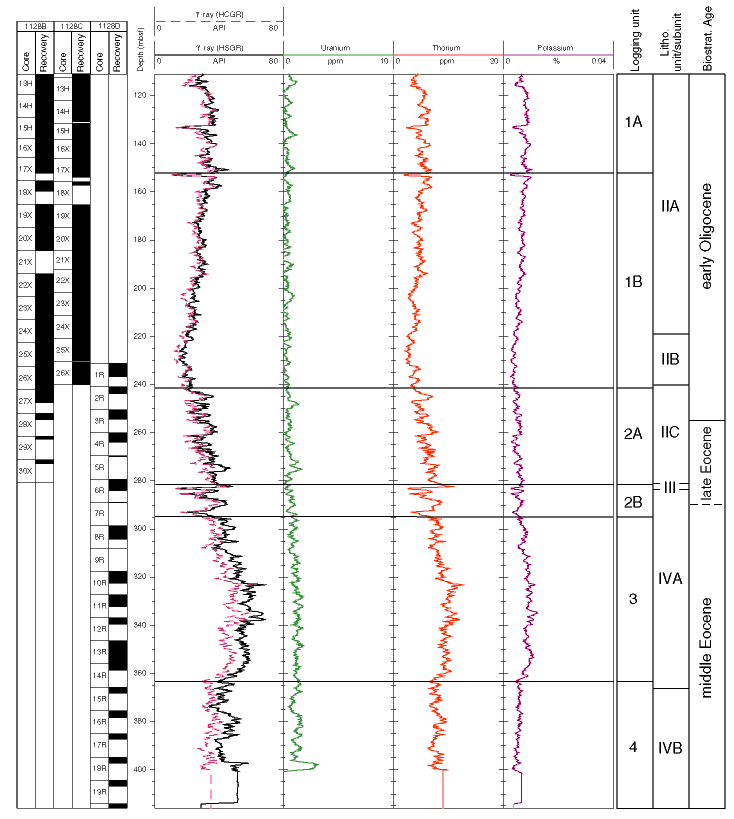
Figure F35. Summary of spectral gamma-ray logs, plotted vs. depth for the open-hole logged interval. The data, plotted from left to right, are core recovery, total gamma radiation (HSGR) and computed (uranium-free) gamma radiation (HCGR), uranium, thorium, potassium, logging units, lithostratigraphic units, and biostratigraphic ages.

![]()