![]()
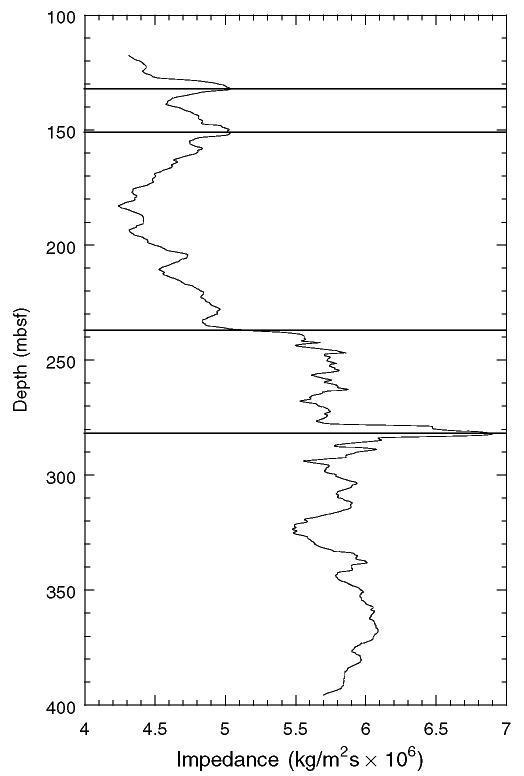
Figure F37. Log of acoustic impedance vs. depth calculated from the density and sonic logs from Site 1128. Horizontal lines indicate potential locations of seismic reflectors. Impedance data have been smoothed through a 5-m smoothing function to produce a resolution comparable to site-survey seismic data.
![]()