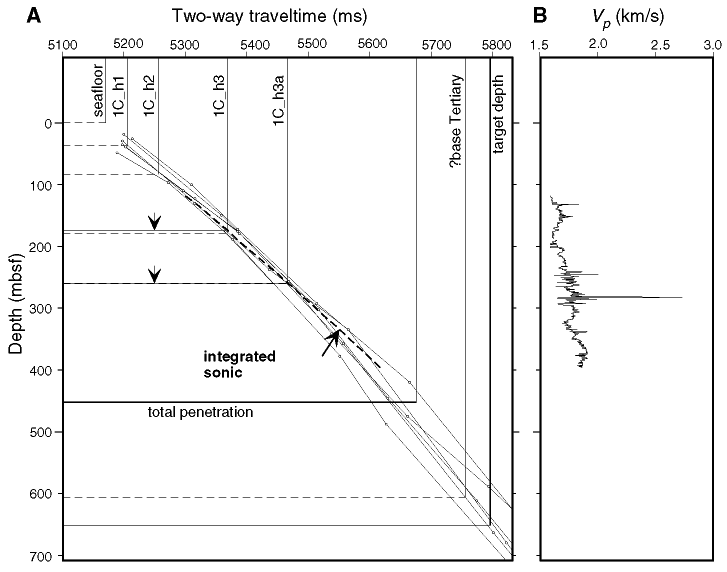
Figure F40. A. Plot showing relationship between predicted depths to key horizons and sequence boundaries (dashed) and corrected depths (arrowed). Corrected depths are based on the integrated sonic log (derived from interval transit-time data) shown plotted as a heavy dashed line relative to plots of site-survey seismic data stacking velocities. B. Plot of the velocity log (from compressional sonic trace) used as the basis for the integrated sonic log.

![]()