![]()
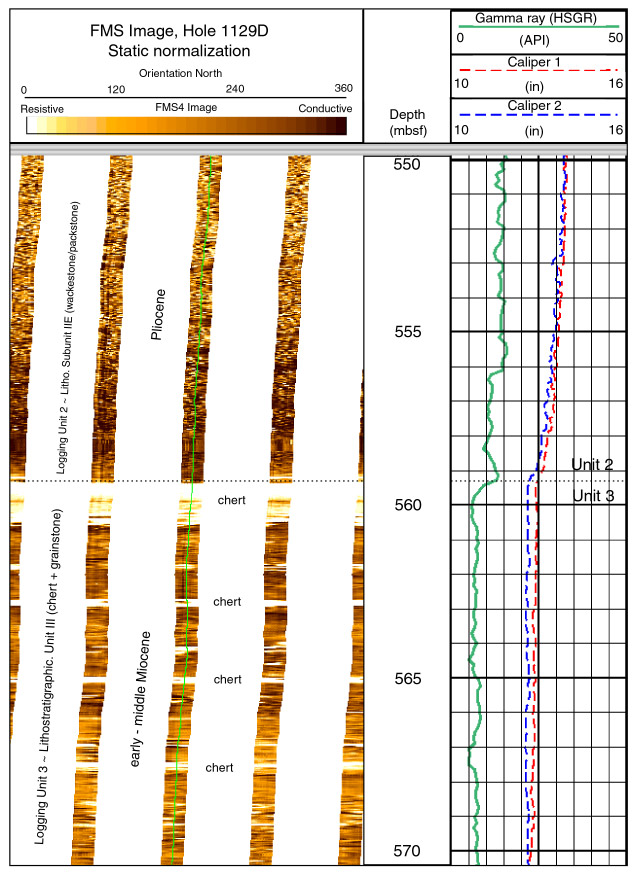
Figure F31. Formation MicroScanner (FMS) image showing the boundary between logging Units 2 and 3, coinciding with the boundary between lithostratigraphic Units II and III. Chert horizons in Unit 3 are imaged as resistive (bright) intervals, whereas the packstone/grainstone (Unit 3) and wackestone/packstone (Unit 2) intervals are shown as more conductive (dark) intervals. The boundary between Units 2 and 3 is defined by the inflection in the gamma-ray curve immediately above 560 mbsf.
![]()