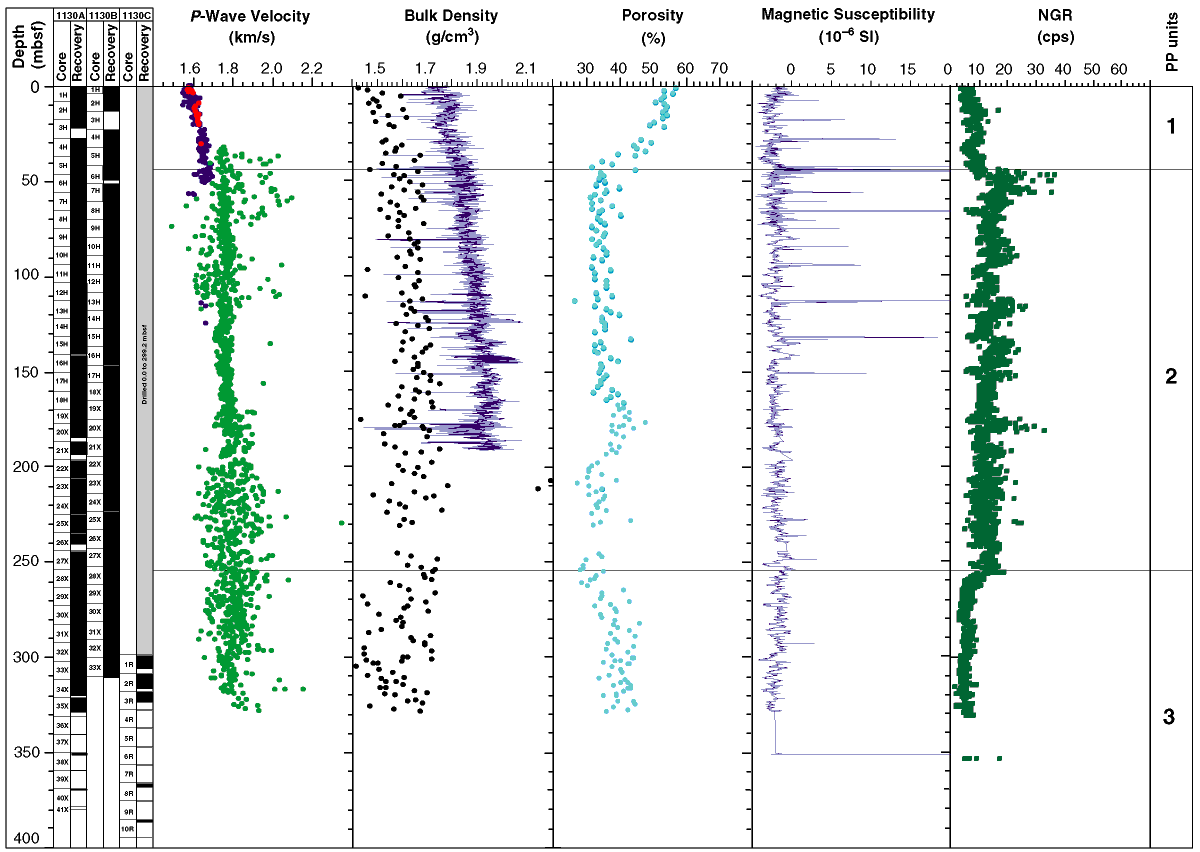
Figure F20. Combined plot of discrete P-wave velocities (PWS1 = red, PWS2 = blue, and PWS3 = green), bulk densities (multisensor track = blue; moisture and density = red), porosity, magnetic susceptibility, and natural gamma radiation (NGR). Physical properties units (PP units) are indicated on the right, and core recovery columns are on the left.

![]()