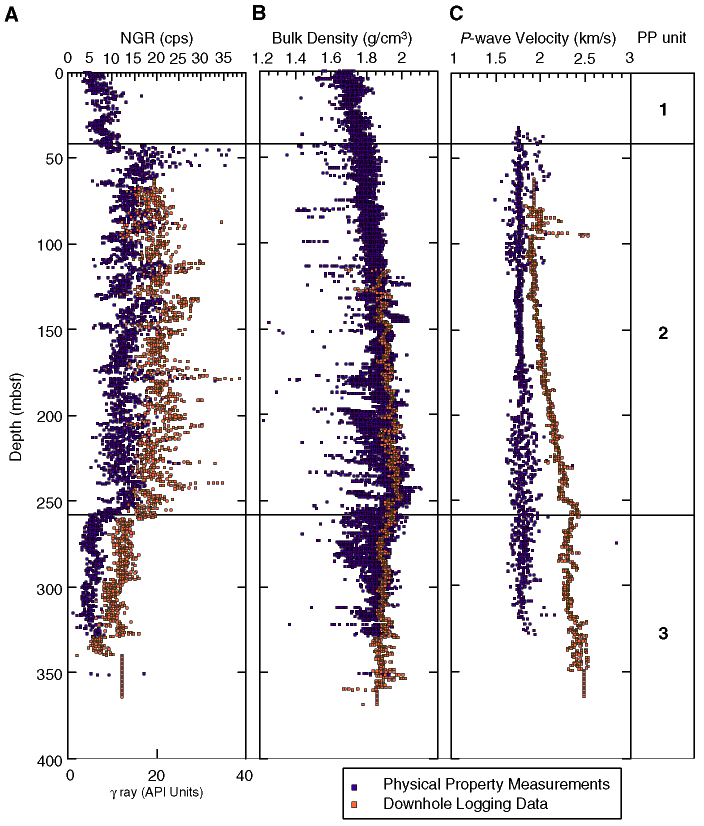
Figure F21. Comparison of downhole logging data and physical properties measurements on recovered sediments. A. Natural gamma-ray data (NGR) from the multisensor track (blue dots) and log data (red dots). B. Bulk density from GRA densiometry (blue dots) and downhole measurements (red dots). C. P-wave velocity from discrete measurements (blue dots) and sonic log (red dots). Physical properties units (PP units) are on the right.

![]()