![]()
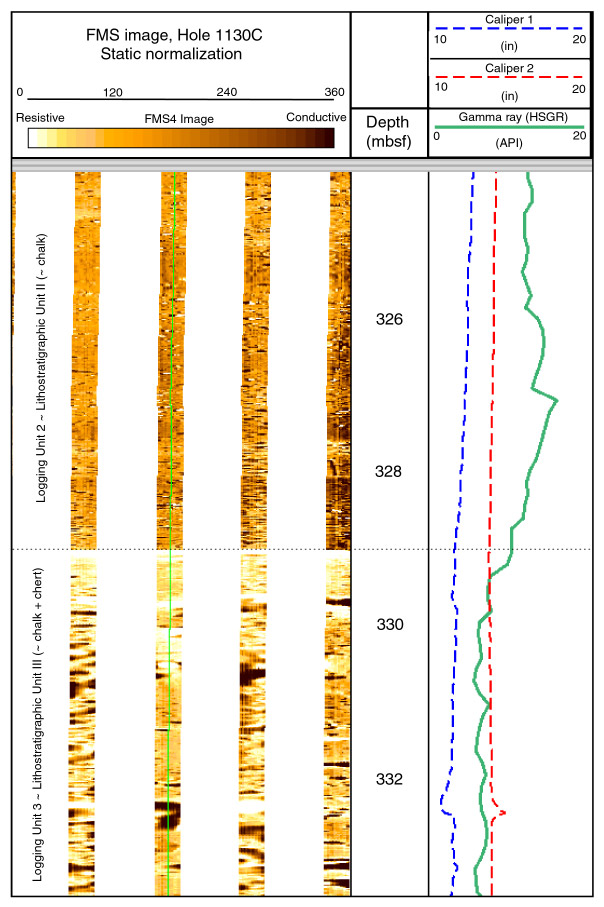
Figure F29. Formation MicroScanner (FMS) image showing the abrupt boundary between logging Units 2 and 3 at 329 mbsf, coinciding with the boundary between lithostratigraphic Units II and III. The depth of this boundary on the FMS images is slightly shallower than the depth measured using conventional logs. This may be an artifact of the triple combination logging tool being run without the wireline heave compensator in this interval. The thinly bedded succession below 329 mbsf represents a sequence of interbedded, thin chert layers (~20 cm) and chalk (1-3 m).
![]()