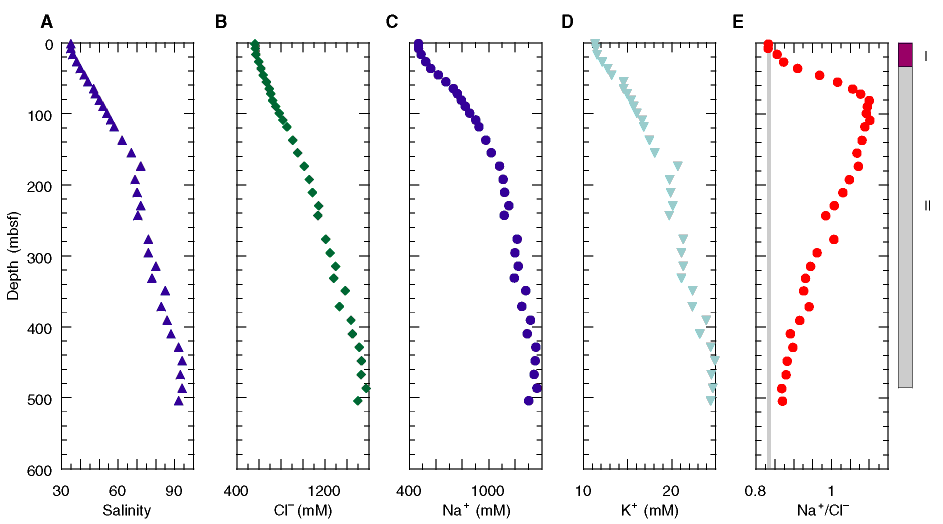
Figure F14. Summary trends in (A) salinity, (B) Cl-, (C) Na+, (D) K+, and (E) Na+/Cl-. Although the trends of the concentrations in these ions show a diffusive profile, the Na+/Cl- ratio shows a maximum between 90 and 120 mbsf. Lithostratigraphic units are shown on the right side of the figure.

![]()