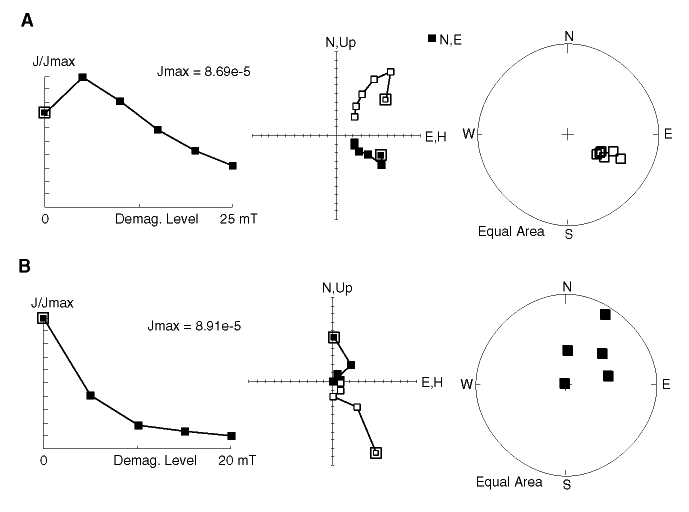
Figure F7. Normalized intensity decay (left), demagnetization diagrams (center), and stereoplot of representative samples (right). A. Alternating field (AF) demagnetization showing two-component magnetization with a characteristic magnetization of normal polarity (Sample 182-1131A-31X-1, 27-34 cm.) B. AF demagnetization showing a prominent overprint and a reverse polarity characteristic magnetization (Sample 182-1131A-48X-1, 45-47 cm.). Demagnetization diagrams show projections of the natural remanent magnetization vector in the vertical (open symbols) and horizontal (solid symbols) planes during progressive demagnetization.

![]()