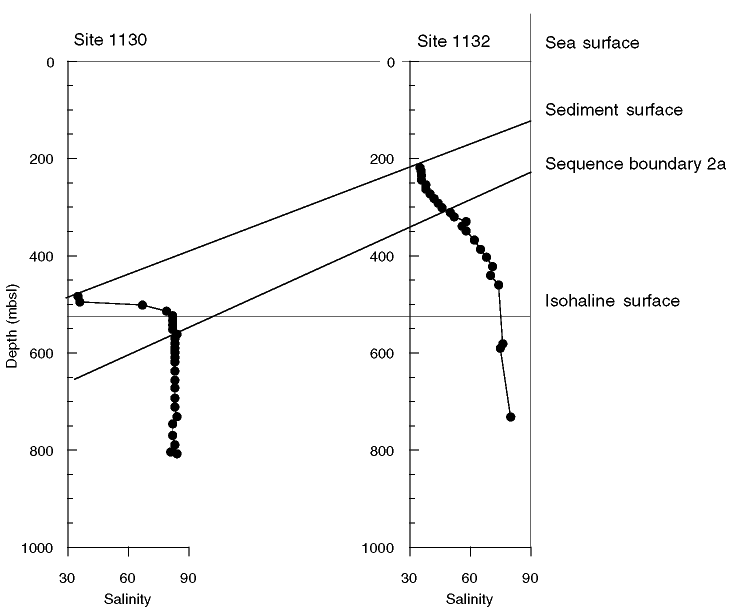
Figure F18. A plot of salinity vs. absolute depth (measured in meters below sea level [mbsl] rather than meters below seafloor [mbsf]) shows that the salinity values for Sites 1130 and 1132 stabilize at about the same depth, which suggests that the main body of the brine is situated ~520 mbsl. A schematic drawing of sequence boundary 2a shows that the brine crosscuts the sequence.

![]()