![]()
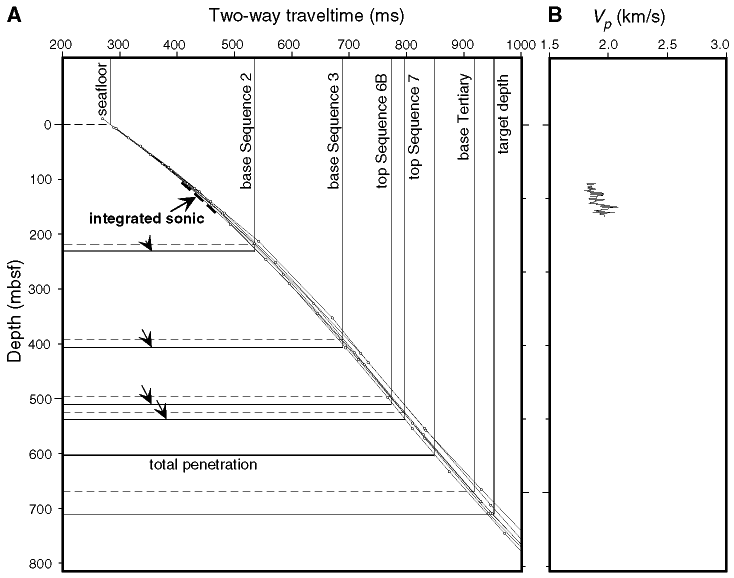
Figure F30. A. Plot showing relationship between predicted depths to seismic horizons and sequence boundaries (dashed) and corrected depths (arrowed) for Site 1132. In the absence of either a check-shot survey or a useful integrated sonic curve, this depth correction is based on an inference that the time-depth correlation line should fall immediately below the envelope of stacking velocity curves derived from six common depth points from site-survey seismic data immediately adjacent to this site, as was the case at Site 1130. B. Because of operational problems, the sonic tool could only be run over a small portion of the hole, and only a small segment of integrated sonic log, based on interval transit time data, can be plotted on A (heavy dashed line).
![]()