![]() Figures F1-F17
Figures F1-F17
![]() Tables
T1-T16
Tables
T1-T16
F1. Map showing Site 1133 in relation to other Leg 182 sites and the AGSO169 seismic lines.
F2. Portion of seismic Line AGSO169/07a showing seismic stratigraphic sequences at Site 1133.
F3. Summary of lithostratigraphy.
F4. Boundary between Units I and II.
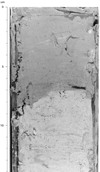
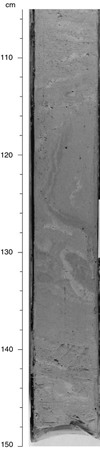
F5. Inclined deformed beds in Hole 1133B.
F6. Calcareous nannofossil and planktonic foraminifer zones, and benthic foraminifer assemblages.
F7. Sedimentation rate curve from datum levels for Site 1133.
F8. Downhole inclination with interpreted magnetostratigraphy.
F9. Demagnetization of NRM, ARM, and IRMs, and of the acquisition of IRM.
F10. Composite depth section produced using Splicer software.
F11. Spliced section of color reflectance data and NMR data produced using Splicer software.
F12. CaCO3 and Corg contents in samples.
F13. Concentration depth profiles of salinity, Cl-, Ca2+, Mg2+, K+, and Sr2+.
F14. Concentration depth profiles of H4SiO40, Li+, Fe2+, NH4+, SO42-, pH, and alkalinity.
F15. Core recovery, NGR, bulk densities, P-wave velocity, porosity, and MS measurements.
F16. Shear strength data.
F17. Thermal conductivity and bulk density data with PP units.
T1. Site 1133 coring summary.
T2. Datum levels used in the graph of sedimentation rate.
T3. Site 1133 core and section depths in mcd and mbsf.
T4. Site 1133 splice tie points.
T5. Headspace gas compositions, Hole 1133B.
T6. CaCO3, Corg, N, and S data.
T7. Interstitial water geochemistry.
T8. XRD data.
T9. P-wave velocity measurements.
T10. GRA densiometry measurements.
T11. Magnetic susceptibility measurements.
T12. Natural gamma-ray measurements.
T13. Discrete P-wave velocity measurements.
T14. Index properties measurements.
T15. Undrained shear-strength measurements.
T16. Thermal conductivity measurements.