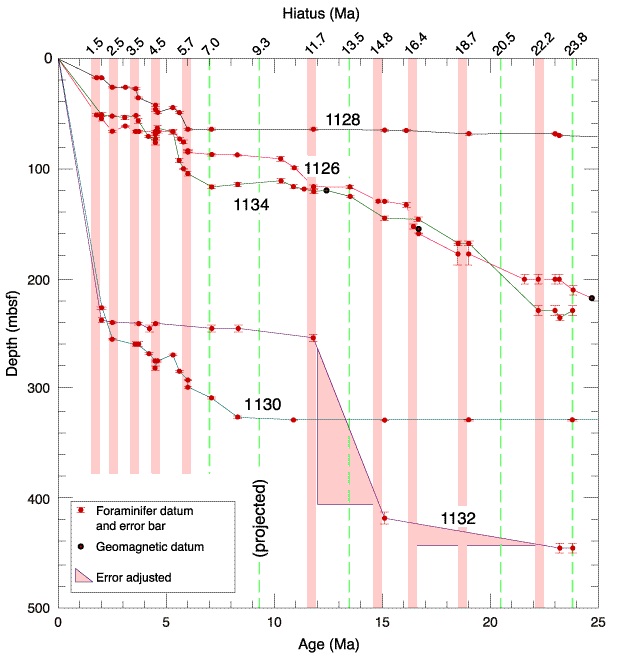
Figure F12. Time-depth diagram for important planktonic foraminifer datums (as listed in Tables T2, T3, T4, T5, and T6), showing position of unconformities and variations of sedimentation rates between sites. The labeled 15 hiatuses are inferred mainly from this data set and partly from changes in the characteristics of related assemblages.


![]()