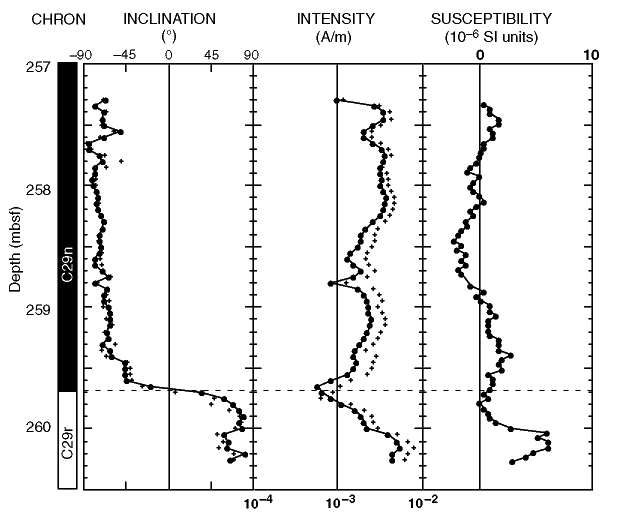
Figure F10. Inclination (left), intensity of remanent magnetization (middle), and susceptibility (right) from Sections 183-1135A-28R-1 and 28R-2. Crosses and lines with circles represent remanent magnetization before and after AF demagnetization at 20 mT, respectively. Interpreted geomagnetic chrons are shown in the left column.

![]()