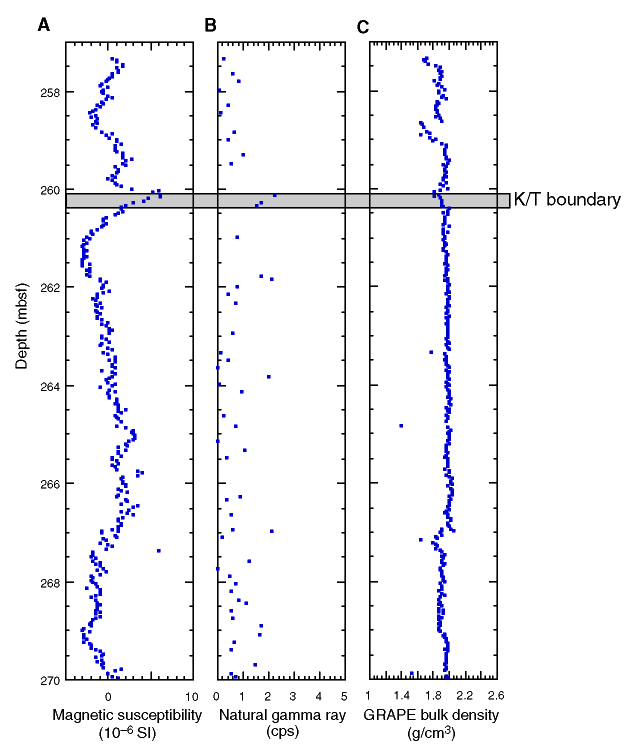
Figure F14. Whole-core measurements of magnetic susceptibility, natural gamma ray, and GRAPE bulk density for Core 183-1135A-28R vs. depth for Site 1135. Note the increase in magnetic susceptibility at the interpreted K/T boundary indicated by the gray zone.

![]()