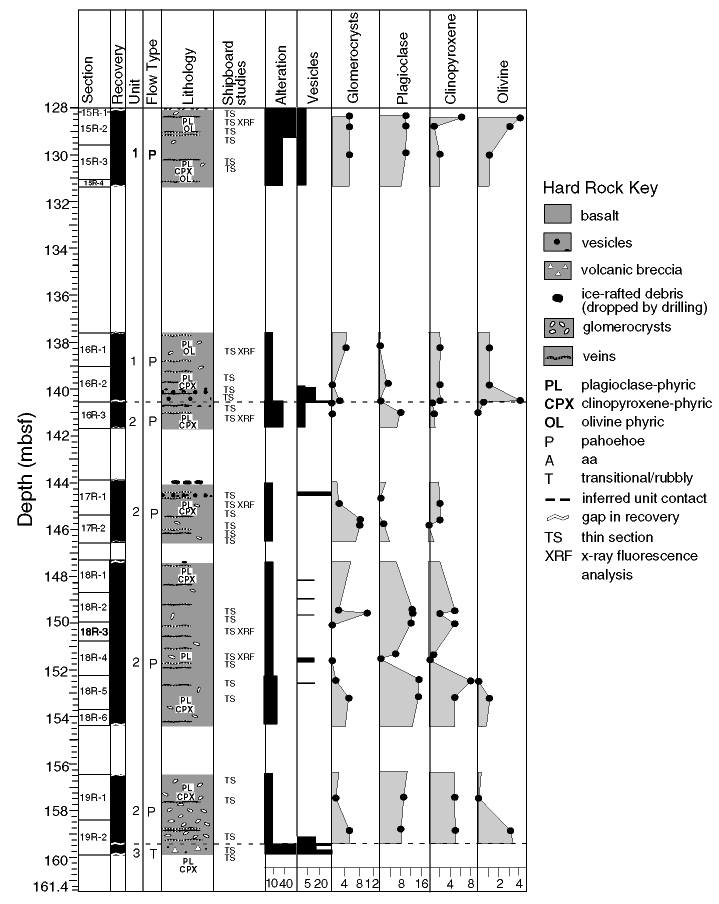
Figure F12. Interpretative summary of the lithology and abundances of phenocryst minerals in the three basaltic flows sampled in Cores 183-1136A-15R through 19R. The proportions of vesicles and phenocrysts, and the degree of alteration, are expressed in volume percent. Solid circles in the four columns on the right of the figure indicate points where thin sections were taken.

![]()