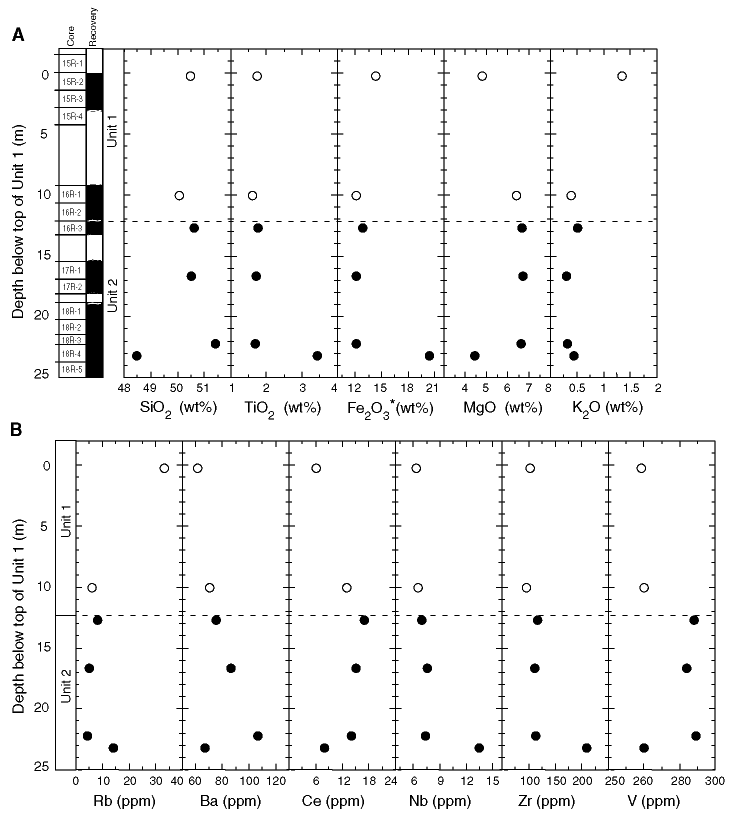
Figure F25. Variations of major and trace element abundances, plotted against depth in Units 1 and 2. A. Major elements. B. Trace elements. Open circles = samples from Unit 1; closed circles = samples from Unit 2. Depths are based on curated depth in mbsf and are calculated relative to the top of Unit 1.

![]()