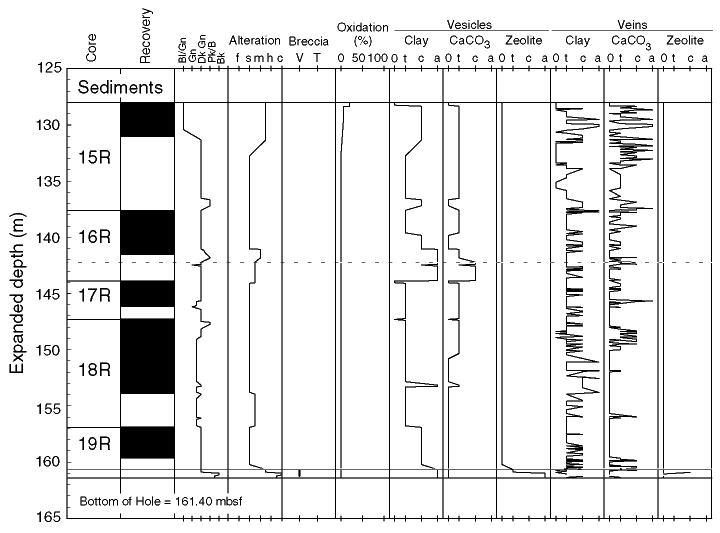
Figure F28. Distribution and abundance of secondary minerals as well as other alteration phenomena in Hole 1136A plotted against expanded depth. The expanded depth was calculated by multiplying the curated depth by the ratio of the recovered core to the interval penetrated. This was done to avoid the clustering of the plotted data at the top of each core caused by the incomplete recovery in a shallow basement penetration. Macroscopic features and mineral occurrences were recorded as observed in hand specimen from the core. The color is the hue of the bulk rock, with dark gray representing the "background" slightly altered basalts. The breccia column shows the distribution of clastic flow tops and tectonic breccias (absent from these cores). Late-stage oxidation (in percent) provides a measure of the extent of late-stage ferric oxide staining present throughout the core. The horizontal dashed lines indicate the igneous unit boundaries. Colors: Bl/Gn = blue-green, Gn = green, dk G = dark gray, Pk/B = pink/brown, Bk = black. Alteration: f = fresh, s = slight, m = moderate, h = high, c = complete. Breccia: V = volcanic flow top, T = tectonic. Mineral abundances of vesicles and veins: 0 = absent, t = trace, c = common, a = abundant.

![]()