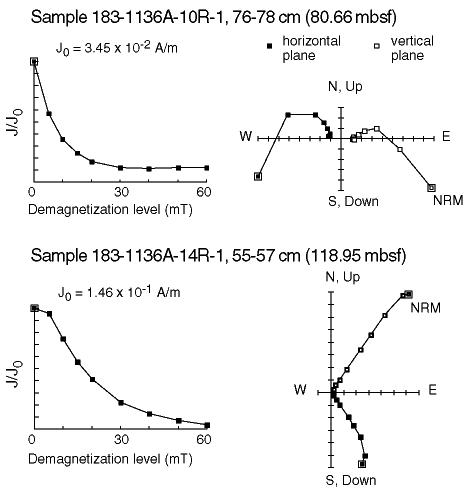
Figure F35. Examples of progressive AF demagnetization of discrete sediment samples from Hole 1136A. The directional change caused by AF demagnetization is plotted on orthogonal vector projections (right). Magnetic directions that tend toward the origin are considered reliable. Intensity changes are plotted on the left. J0 is the magnetization intensity before AF treatment.
![]()