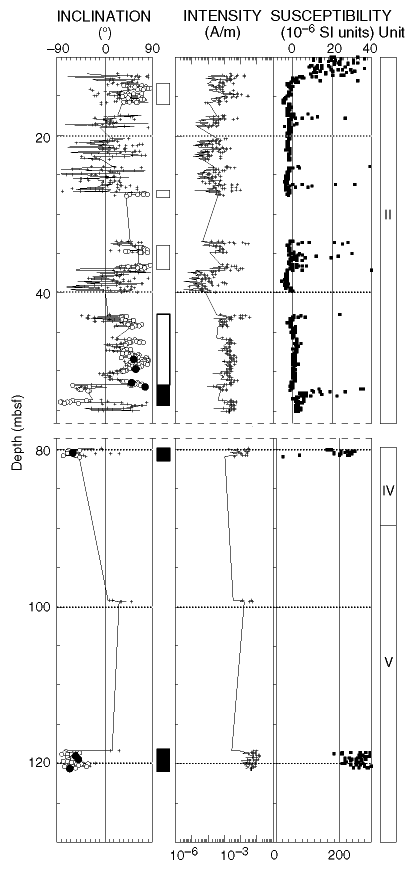
Figure F36. Inclination, intensity of remanent magnetization, and MST susceptibility of Hole 1136A sediments vs. depth. Crosses and lines represent remanent magnetization before and after AF demagnetization at 20 mT, respectively. Selected inclination data (see "Paleomagnetism") used for polarity interpretations are shown by open circles. Interpreted normal and reversed geomagnetic chrons are shown by black and white rectangles, respectively. Inclinations from discrete samples are shown by solid circles. Lithologic units are shown on the right.

![]()