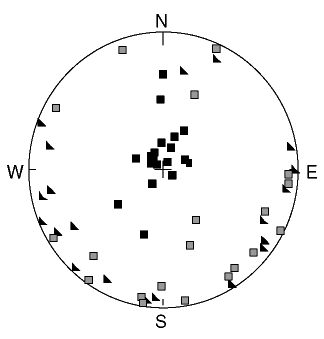
Figure F40. Directional anisotropy data from 20 Hole 1136A discrete basement samples plotted on an equal-area stereographic projection. The directions of maximum principal axes are plotted as triangles, of intermediate principal axes as gray squares, and of minimum principal axes as black squares. The minimum axes are grouped at an inclination of 90°, and the maximum and intermediate directions lie within a girdle 90° from the minima.
![]()