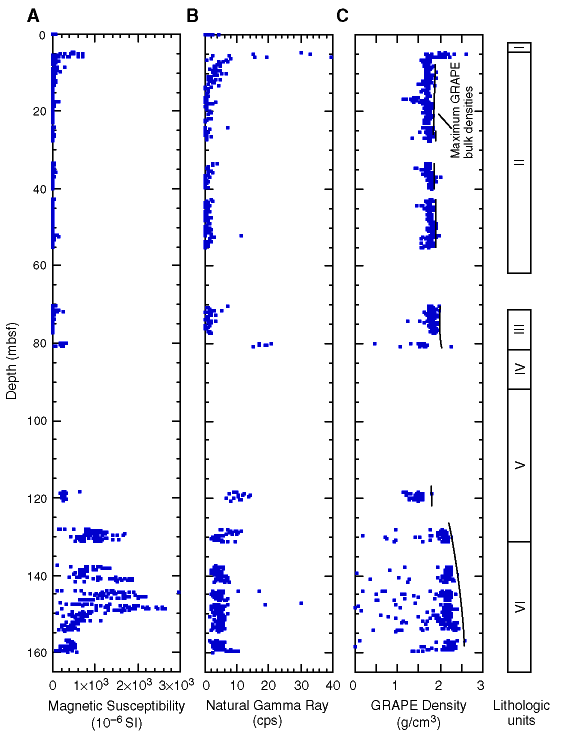
Figure F42. Downhole profiles of whole-core measurements of (A) magnetic susceptibility, (B) natural gamma ray, and (C) GRAPE bulk density from Site 1136. The lines on the GRAPE bulk density graph are the visually estimated maximum GRAPE bulk density. Lithology units to the far right.

![]()