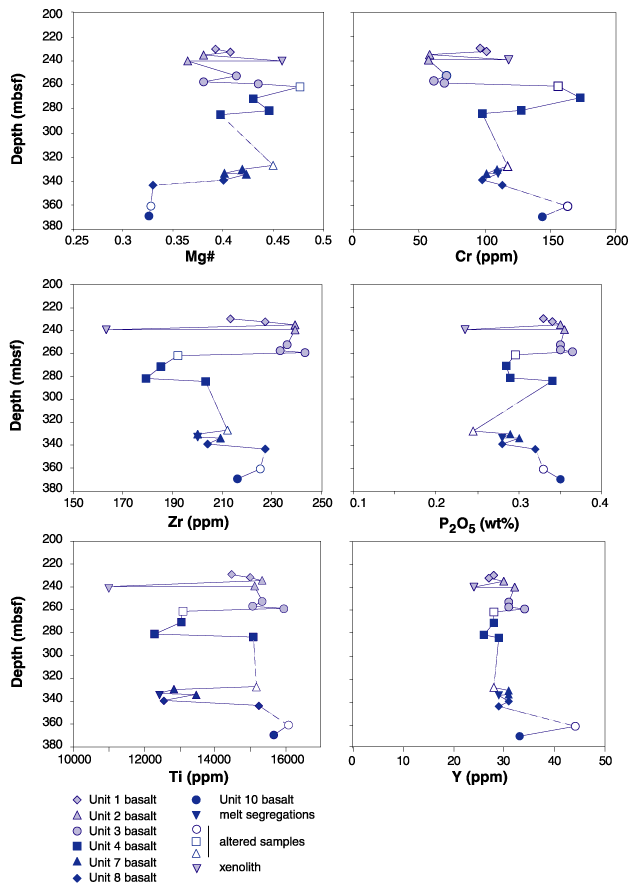
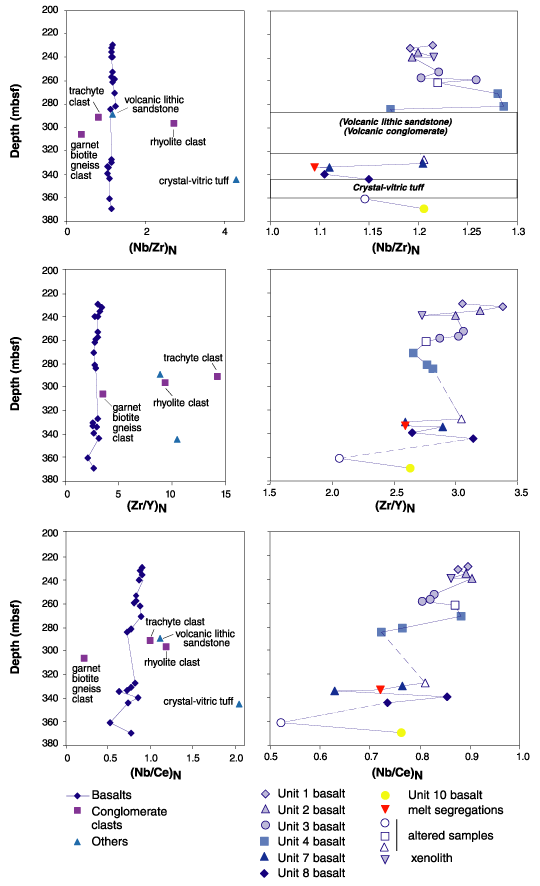
Figure F57. A. Variations of major and trace element abundances and Mg# (Mg# = molar MgO/[MgO + FeO]) with depth in Hole 1137A. Each flow unit is represented by a different symbol. Open symbols represent altered samples and down-pointing triangles represent a xenolith and a melt segregation. Depths correspond to the curated depth in mbsf. B. Variations of trace element ratios normalized to primitive mantle values of Sun and McDonough (1989), for basalts from Site 1137, three clasts in the conglomerate, the lithic volcanic sandstone, and the crystal vitric tuff, plotted against depth in the basement section of Hole 1137A.


![]()