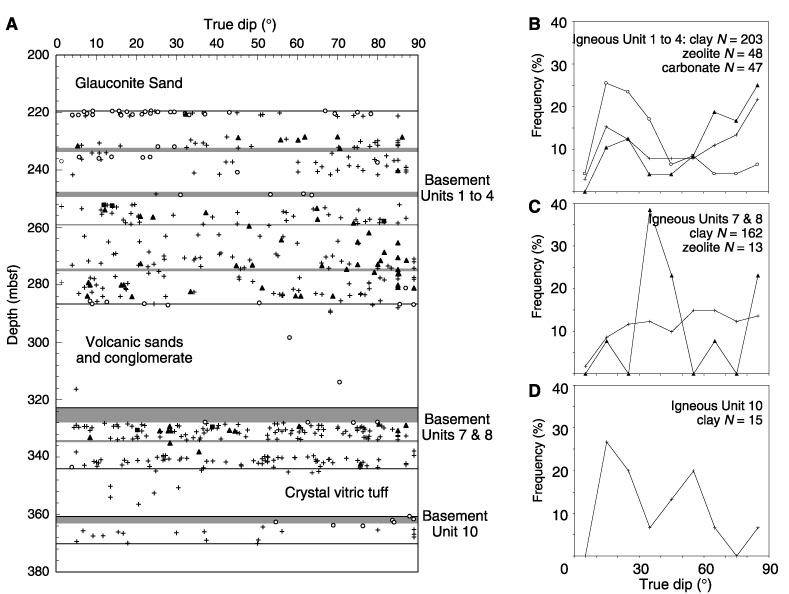
Figure F72. A. Diagram showing the unoriented true dip of veins in basement rocks from Hole 1137A. Veins are subdivided by the dominant mineral filling, and the true dip is plotted vs. depth. Rare veins in the intercalated volcaniclastic sediments are also shown. Zones of igneous brecciation are delineated by horizontal gray bands. B. Histogram showing the distribution of vein orientations subdivided by mineral filling in basement Units 1 to 4. C. Histogram showing the distribution of vein orientations subdivided by mineral filling in basement Units 7 and 8. D. Histogram showing the distribution of vein orientations subdivided by mineral filling in basement Unit 10. Note that crosses = clay; open circles = calcium carbonate; solid triangles = zeolites; solid squares = amorphous silica.

![]()