![]()
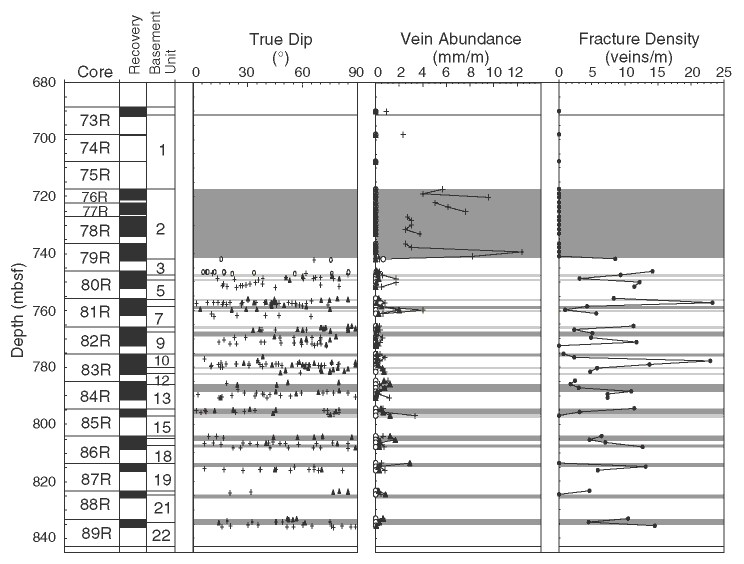
Figure F70. A. Diagram showing the unoriented true dip of veins in basement rocks from Hole 1138A. We subdivide veins by the dominant mineral filling and plot the true dip vs. depth. Zones of igneous brecciation are delineated by horizontal gray bands and abundance of mineral filled veins with depth in Hole 1138A. We subdivide veins by the dominant mineral filling and calculate vein abundance as an equivalent vein thickness in millimeters of vein material per meter of recovered drill core (in millimeters per meter). B. Diagram showing the total fracture distribution, which we calculate from the total number of veins of any thickness per meter of recovered core. We present data on a core by core basis. Crosses = clay; open circles = calcium carbonate; solid triangles = zeolites.
![]()