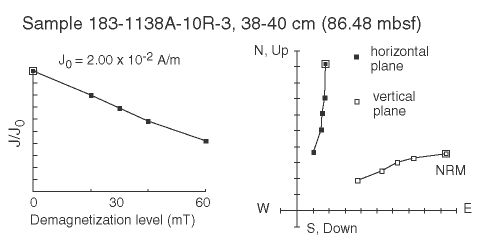
Figure F72. Example of progressive AF demagnetization of a discrete sediment sample. The intensity decay curve is plotted on the left, and the directional change is plotted on an orthogonal vector projection on the right. Magnetic directions that tend toward the origin with high median destructive fields are considered reliable. J0 is the magnetization intensity before AF treatment.

![]()