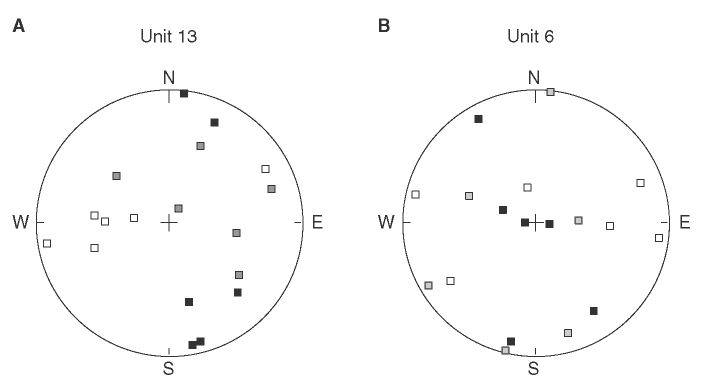
Figure F76. Directional anisotropy data from samples of (A) Unit 13 and (B) Unit 6 plotted on an equal-area stereographic projection. The directions of maximum principal axes are plotted as open squares, of intermediate principal axes as gray squares, and of minimum principal axes as black squares.

![]()